The two markets inside one community
In the first five months of 2026, Jumeirah Golf Estates sold more villas than a year earlier. But the resale market for finished homes slowed, and off-plan did most of the buying. This issue also covers the rental market and how the conflict showed up in the figures.
Welcome to Issue 2 of the Benjamin Baker JGE newsletter. Here's where the Jumeirah Golf Estates market stands, five months into 2026.

This issue covers a period none of us will forget. The regional conflict that began in late February touched Dubai directly, and it touched the market. I'm not going to pretend otherwise, and I'm not going to dress it up. What follows is what actually happened to JGE prices and sales through it, and what I saw on the ground as someone who lives here and kept working through it.
Jumeirah Golf Estates' villa market closed Jan–May 2026 stronger than Jan–May 2025 by every headline measure. 349 villa sales registered with the Land Department against 210. Total value cleared AED 4.6 billion against AED 2.4 billion. Average sale price rose to AED 13.2 million from AED 11.6 million.
The shape behind those numbers is the story.
Ready villa sales, meaning finished homes changing hands, halved against last year. 70 in Jan–May 2026 against 146 in Jan–May 2025. Off-plan sales, homes bought before they are built, more than quadrupled. 279 against 64.
Two markets. Two seller types. One community.
The ready market in JGE is mostly owners who have lived here for years. From where I sit in the community, most simply don't need to sell. In my five years working here in JGE I see this pattern often: when confidence softens, listings of finished homes dry up faster than the headline numbers suggest. Owners who would only sell at a strong price hold back rather than discount. The supply of existing homes for sale tightens. The sales that do happen cluster at the top end. That is what the Jan–May 2026 numbers describe.
Off-plan in JGE works on a different time frame. Wasl's Next Chapter releases hand over in 2028 and 2029. Buyers entering off-plan in Jan–May 2026 are looking at a three-year wait before the home is built. Weekly headlines don't carry the same weight that far ahead.
In May 2026, the number of ready sales fell below May 2025. The first month in these five where resales declined against the year before. The same pattern shows across the other prime Dubai communities people compare JGE to. Palm Jumeirah's resales fell 42 percent in Jan–May 2026 against the same months last year. Emirates Hills 58 percent. Al Barari 14 percent on resales. Tilal Al Ghaf 19 percent.
JGE's resale market sits inside a Dubai-wide story this period. Off-plan sales kept moving. Resales slowed.
This issue maps both, week by week, neighbourhood by neighbourhood, against that wider Dubai picture.
Availability at Cedarwood Estates South is limited. Contact me directly if you'd like to discuss it. Full launch coverage sits in Section 7.
Section 2. JGE Jan–May 2026 in numbers
70 ready sales over the five months. 279 off-plan. The distance between those two is what this issue is really about.
Across the five months that is 349 villas sold, up from 210 in the same stretch last year. The money changing hands rose from AED 2.4 billion to AED 4.6 billion. The average sale went from AED 11.6 million to AED 13.2 million. More sales, and bigger ones.
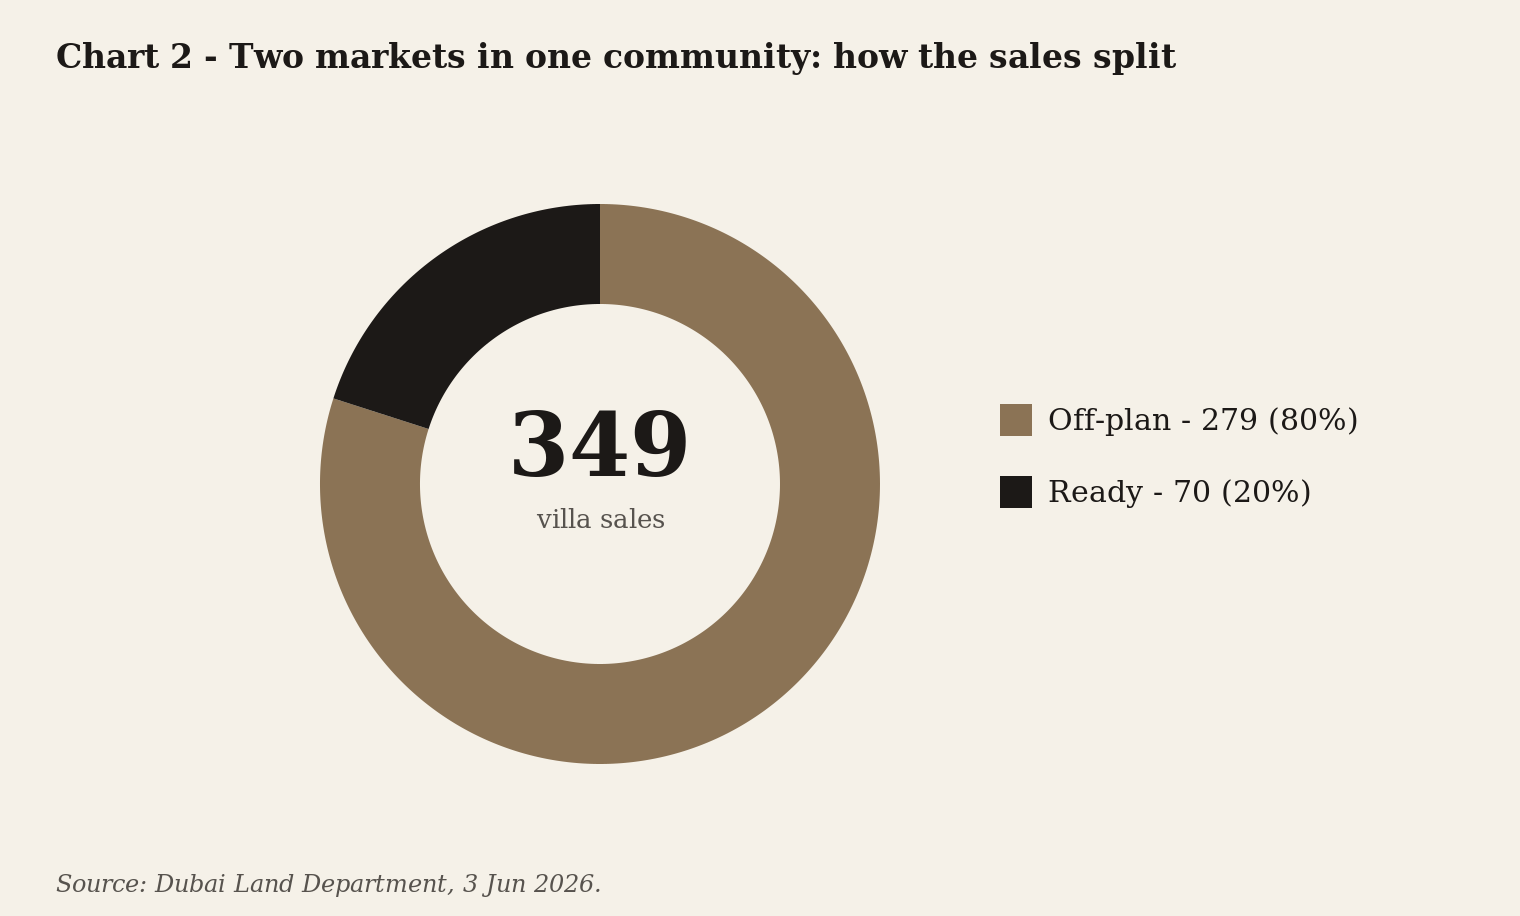
Resales fell by half against last year, 70 against 146. Off-plan more than quadrupled, 279 against 64. The circle above shows that split at a glance.
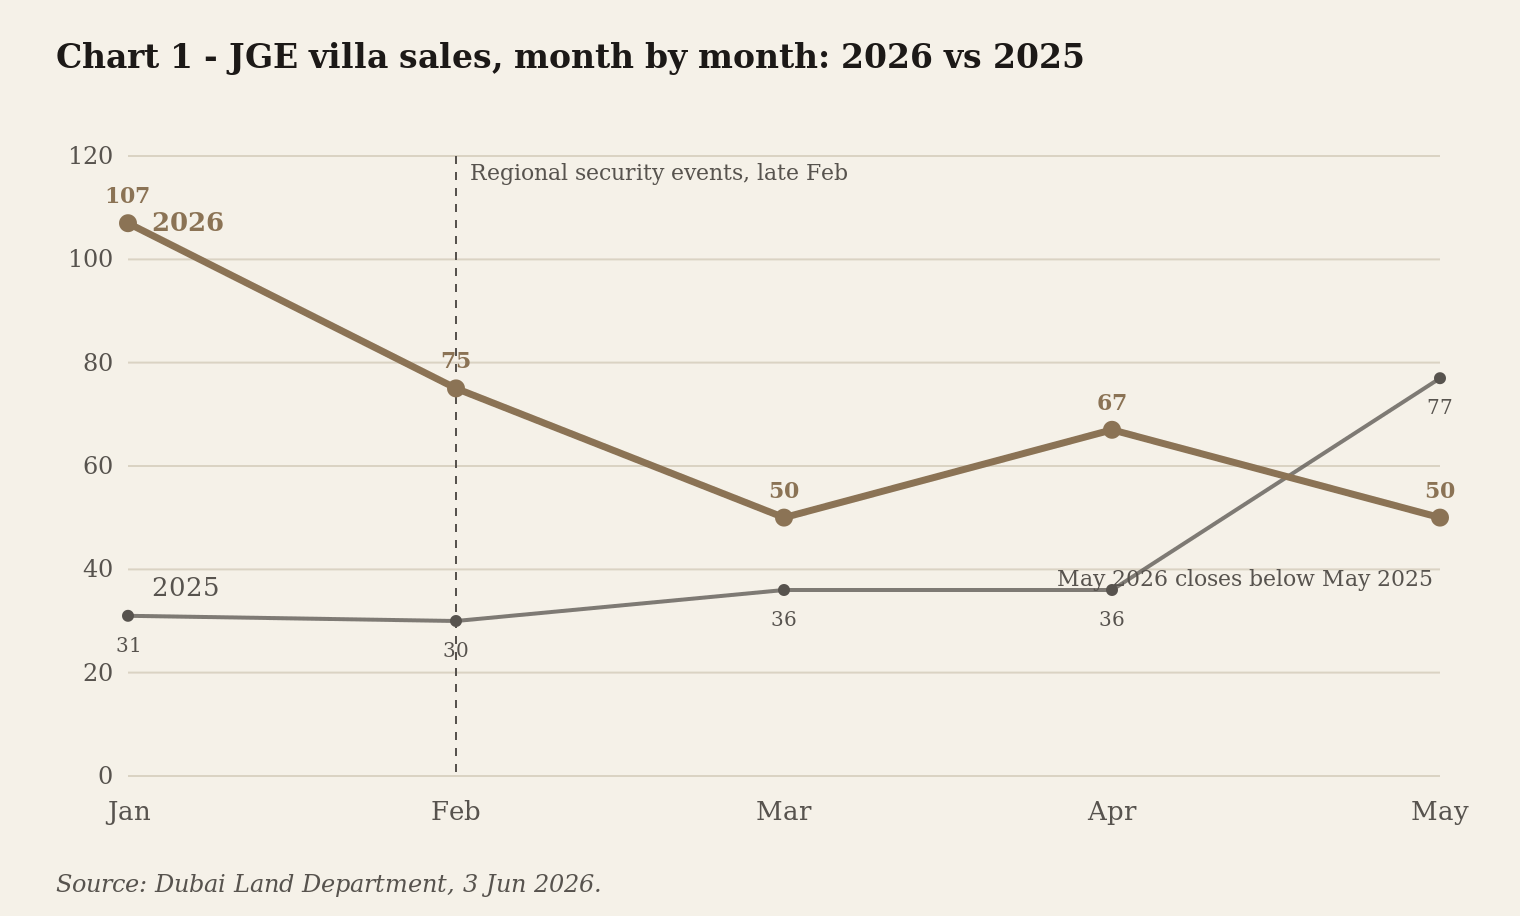
January saw 107 villa sales. February 75. March 50. April 67. May 50. The same months last year were 31, 30, 36, 36 and 77. The first three months of 2026 ran more than three times the pace of early 2025.
January and February this year were among the busiest months I have seen in five years working here in JGE. The start of the year was the busiest I have seen. March slowed. April picked back up. May finished below last May outright.
May is where the issue turns, and it is also where one quirk of the data matters most. Every sale here is registered with the Land Department through a contract both sides sign, called Form F. That registration can take one to three months to show up in the public record after the two parties have actually shaken hands. So the May 2026 count will keep filling in through July as the later paperwork lands. May 2025 has had a full year to settle by comparison. The gap between the two will move between now and publication, and again by the autumn.
Table 1 — JGE villa transactions, Jan–May 2026 vs Jan–May 2025
Counts and totals only. No price-per-square-foot figures here.
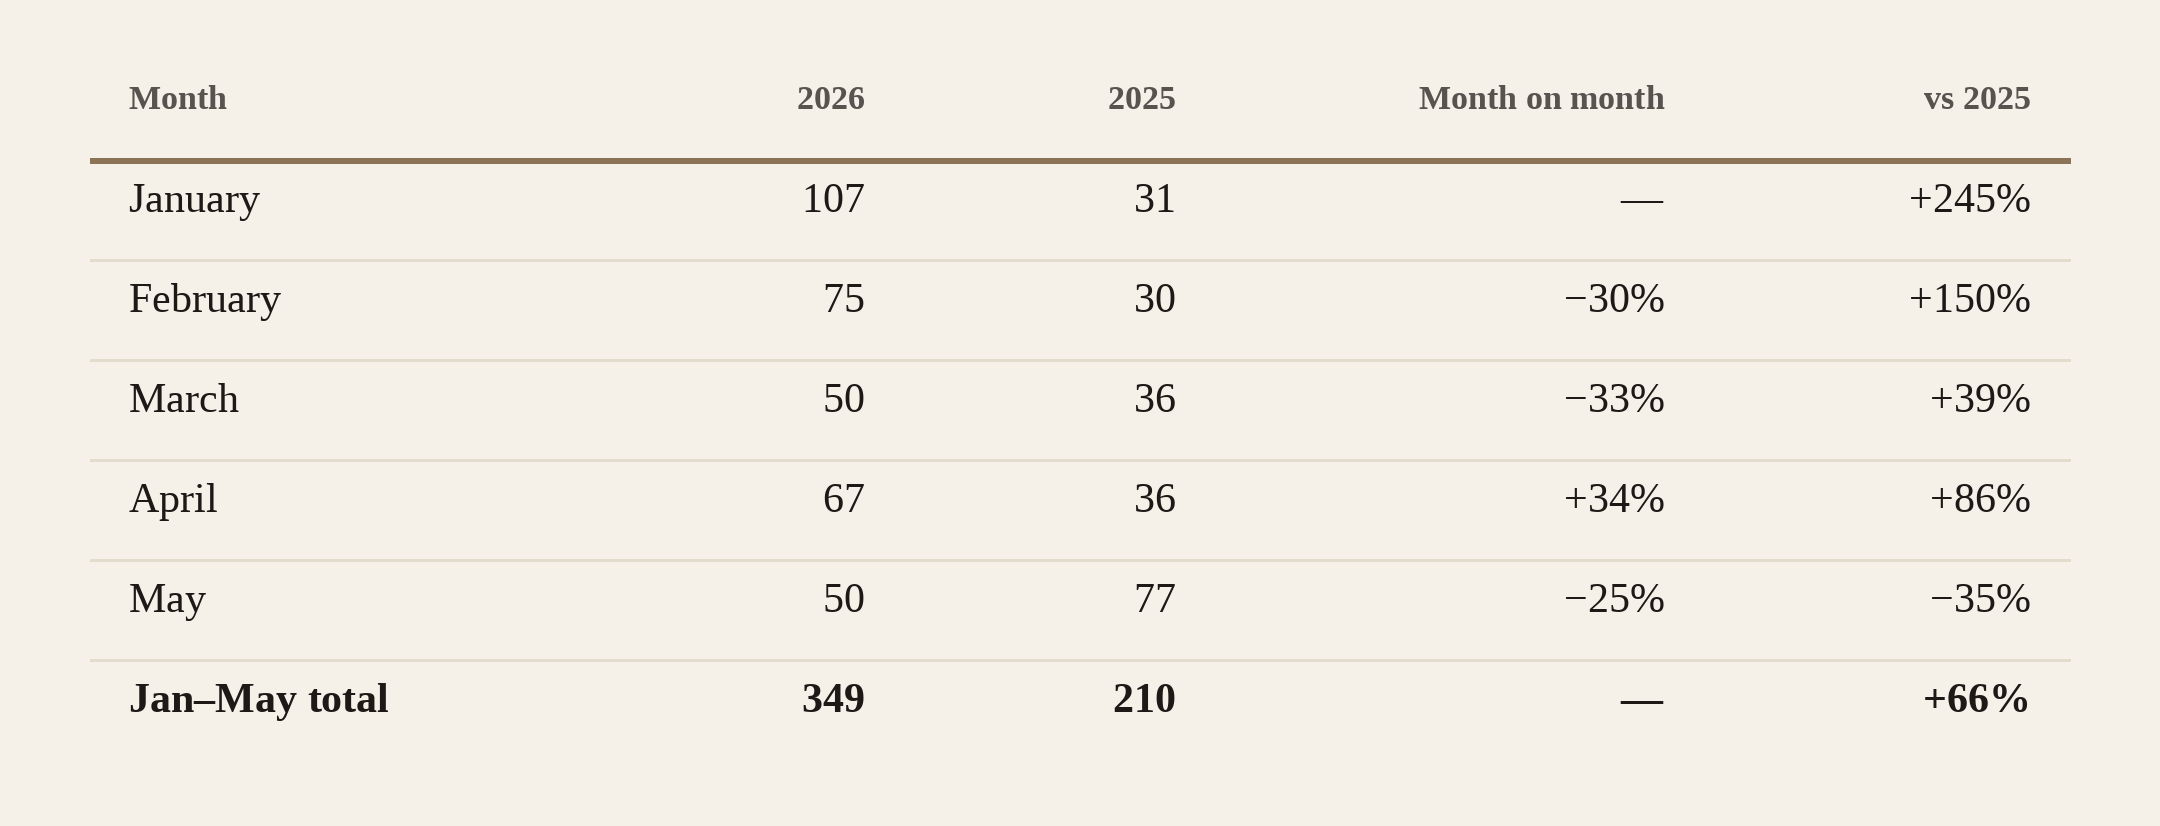
Source: Dubai Land Department, retrieved 5 June 2026. May 2026 keeps firming as later Form F registrations clear.
Section 3. Sub-community breakdown: Phase 1
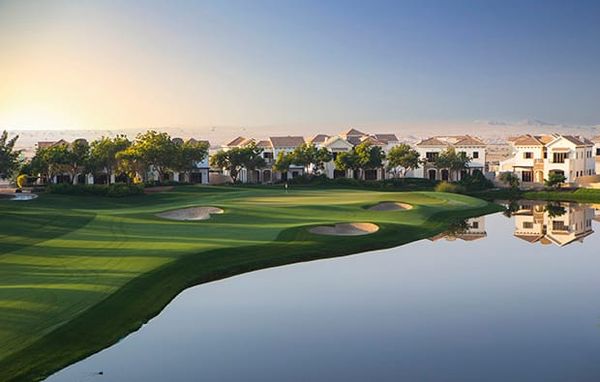
JGE is built in two halves. Phase 1 is the older, finished part, where people already live. It is divided into smaller named neighbourhoods, which the data calls sub-communities or clusters. This section walks Phase 1 one neighbourhood at a time.
Jasmine Lane saw the most movement of any of them. Eighteen ready sales in five months, roughly one a week.
Townhomes at 2BR and 3BR around AED 4 to 6 million transact when villas at AED 15 million plus stand still. Jasmine Lane is the entry door into the JGE postcode. The average JGE ready villa sale this period was AED 15.1 million. The AED 13.2 million headline average covers all transactions, ready and off-plan combined.
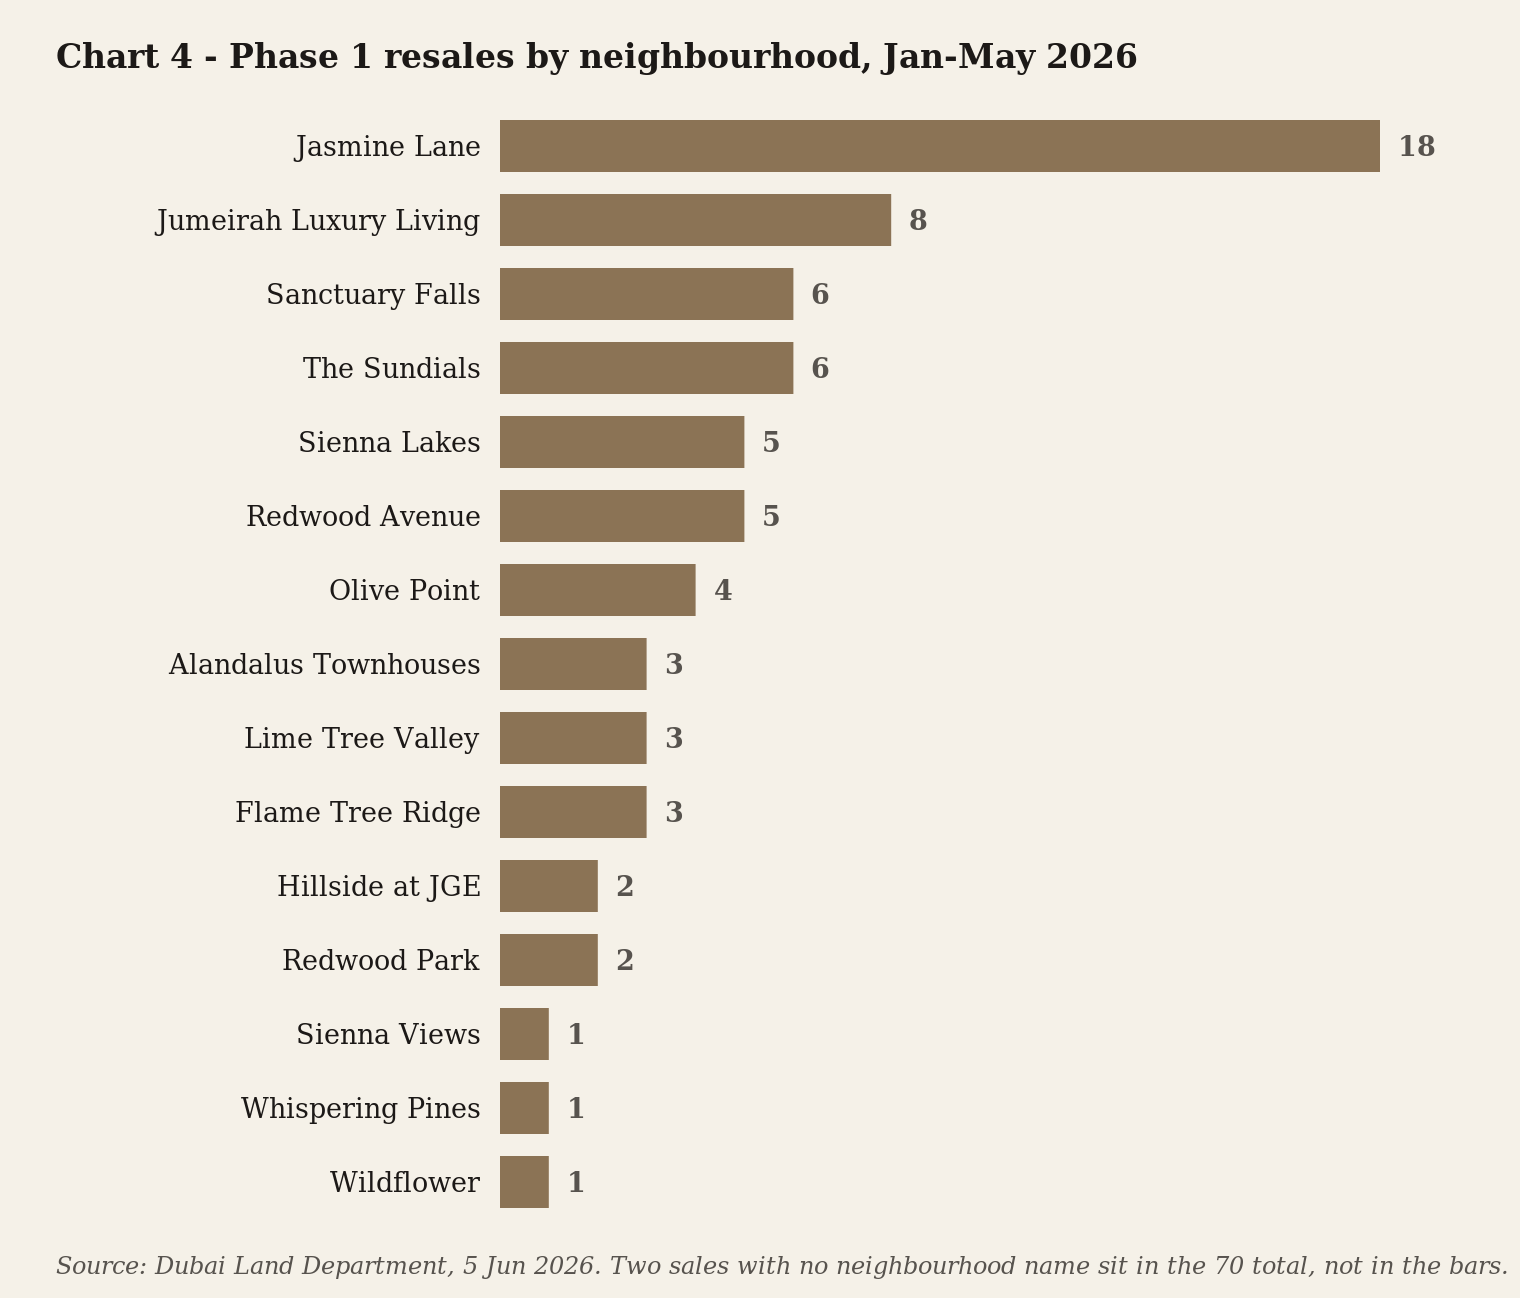
Lime Tree Valley, Alandalus Townhouses and Flame Tree Ridge each had three sales. Hillside and Redwood Park two each. What I see on the ground matches the data exactly. Owners who would only sell at a strong price are not putting their homes up. The few neighbourhoods where I expected ten or more sales showed a handful, or none.
The most telling neighbourhoods are the quietest. Whispering Pines had one ready sale across the five months. Wildflower one. Sienna Views one. In a normal year these three together would see fifteen or more. Three is a striking low. Whispering Pines and Wildflower are where the longest-settled owners live, the people with no reason to move. They simply did not put their homes up for sale. The owners with the least pressure to sell were the first to sit tight.
Orange Lake had no ready sales at all in these five months. That is a real zero, not a gap in the data.
Two ready sales came through without a neighbourhood name attached in the records. They count toward the JGE total, but I have left them out of the table below rather than guess where they belong.
Almost none of the 279 off-plan sales happened in Phase 1. Off-plan buying is concentrated in Phase 2, the newer part still being built. Sections 6 and 7 cover that.
Table 2 — Phase 1 ready villa transactions by sub-community, Jan–May 2026
The total and average sale price for each neighbourhood. Not price per square foot.
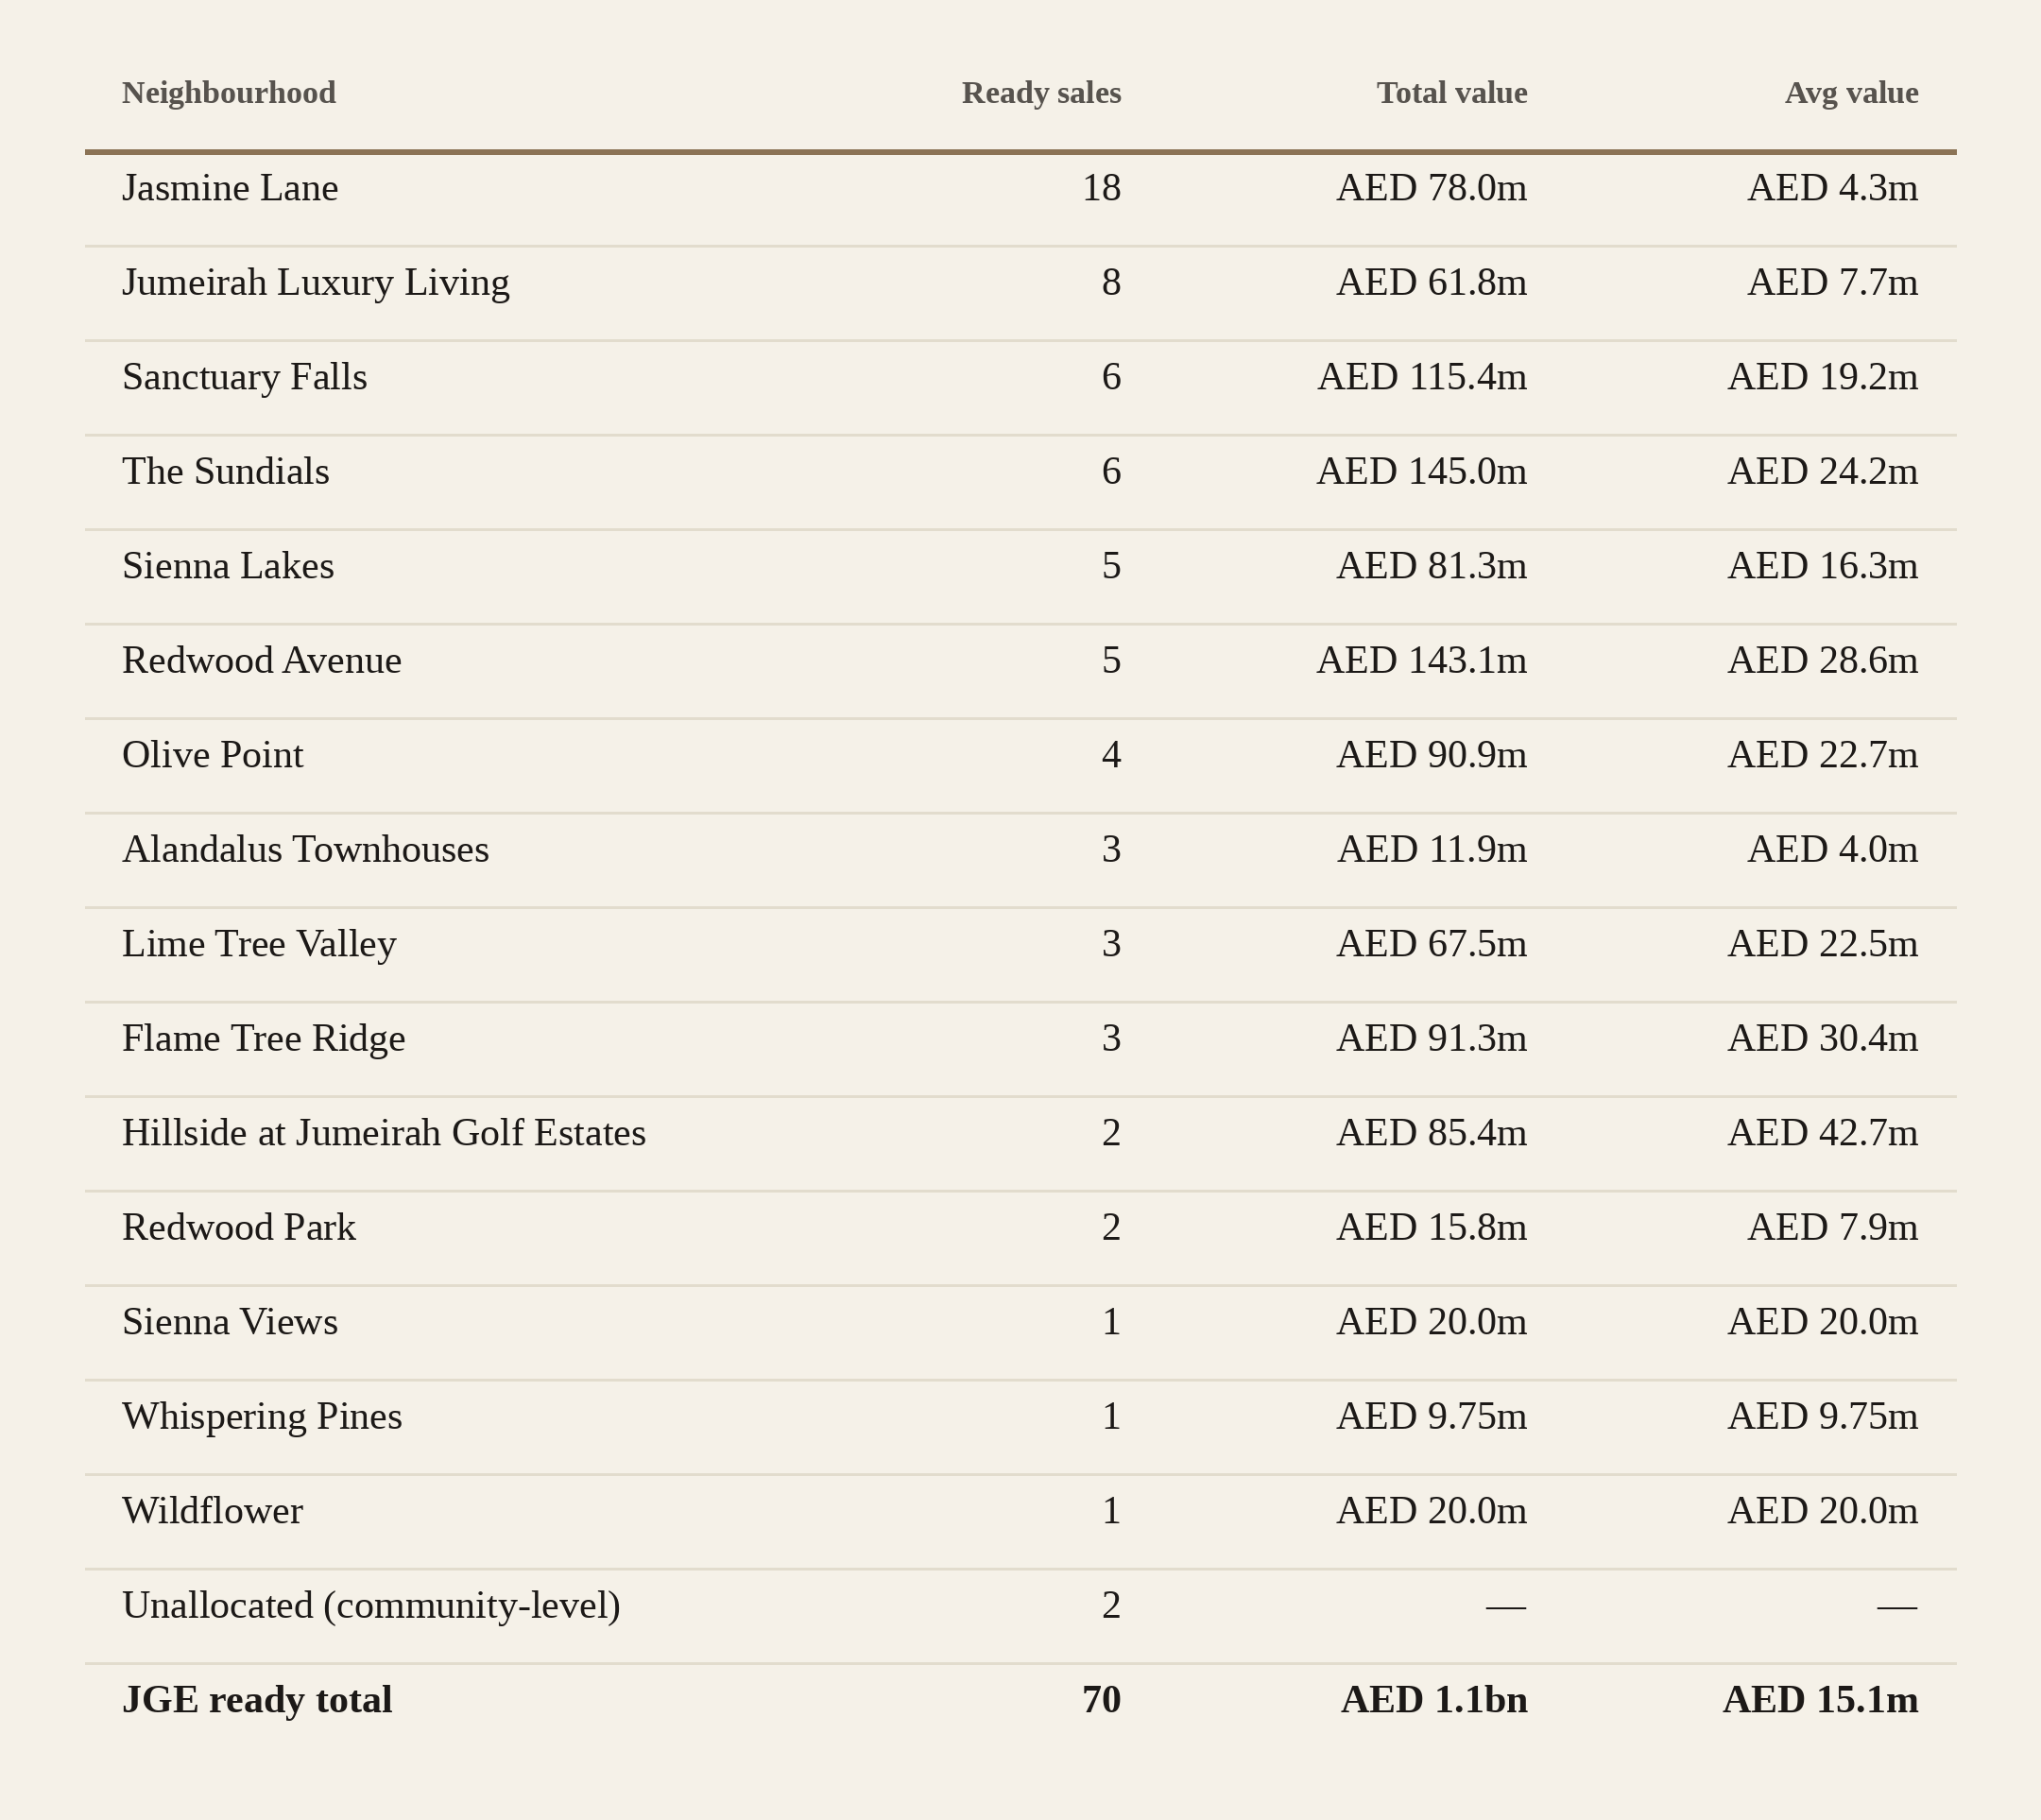
Source: Dubai Land Department, 5 June 2026. Counts and per-cluster values final (6 June pull). Two community-level transactions are in the 70 total with no sub-community label.
Section 4. Al Andalus: the apartments inside a villa community
JGE was planned as a villa community, and almost every sale in this issue is a villa. But it holds one cluster of apartments, called Al Andalus, and I am asked about it often enough to give it a section of its own.
Everything here is separate from the 349 villa sales above. These are apartments, counted on their own. None of these figures are part of the villa headline, the AED 4.6 billion, or any total elsewhere in this issue.
Twenty-seven Al Andalus apartments sold in Jan–May 2026, against forty in the same months last year. Fewer sales, down by about a third. Every one was a ready home, a finished apartment changing hands. None were off-plan, because the building was completed years ago.
The money tells a steadier story. The twenty-seven sold for AED 46.4 million in total, an average of AED 2.0 million each. Last year's forty averaged AED 1.8 million. So fewer apartments changed hands, but each one sold for more. Per square foot, the average rose from about AED 1,400 to about AED 1,600.
By size, the sales fell almost evenly across the two smallest formats. Twelve were one-bedroom homes, which here run about 750 square feet, or about 1,000 with a study. Thirteen were two-bedroom, around 1,350 square feet. One three-bedroom and one four-bedroom made up the rest. Those larger formats trade rarely.
Honest about the scale: this is an apartment option inside a villa community, not a market in its own right. Twenty-seven sales sit beside 349 villas. But for a buyer who wants the JGE postcode at an apartment price, Al Andalus is the only door. It is holding its value per foot while volume thins, the same shape the villas show: fewer sales, firmer prices.
Table 3 — Al Andalus apartment transactions, Jan–May 2026 vs Jan–May 2025
Apartments only. These figures are separate from the villa totals in this issue and are not part of the 349.
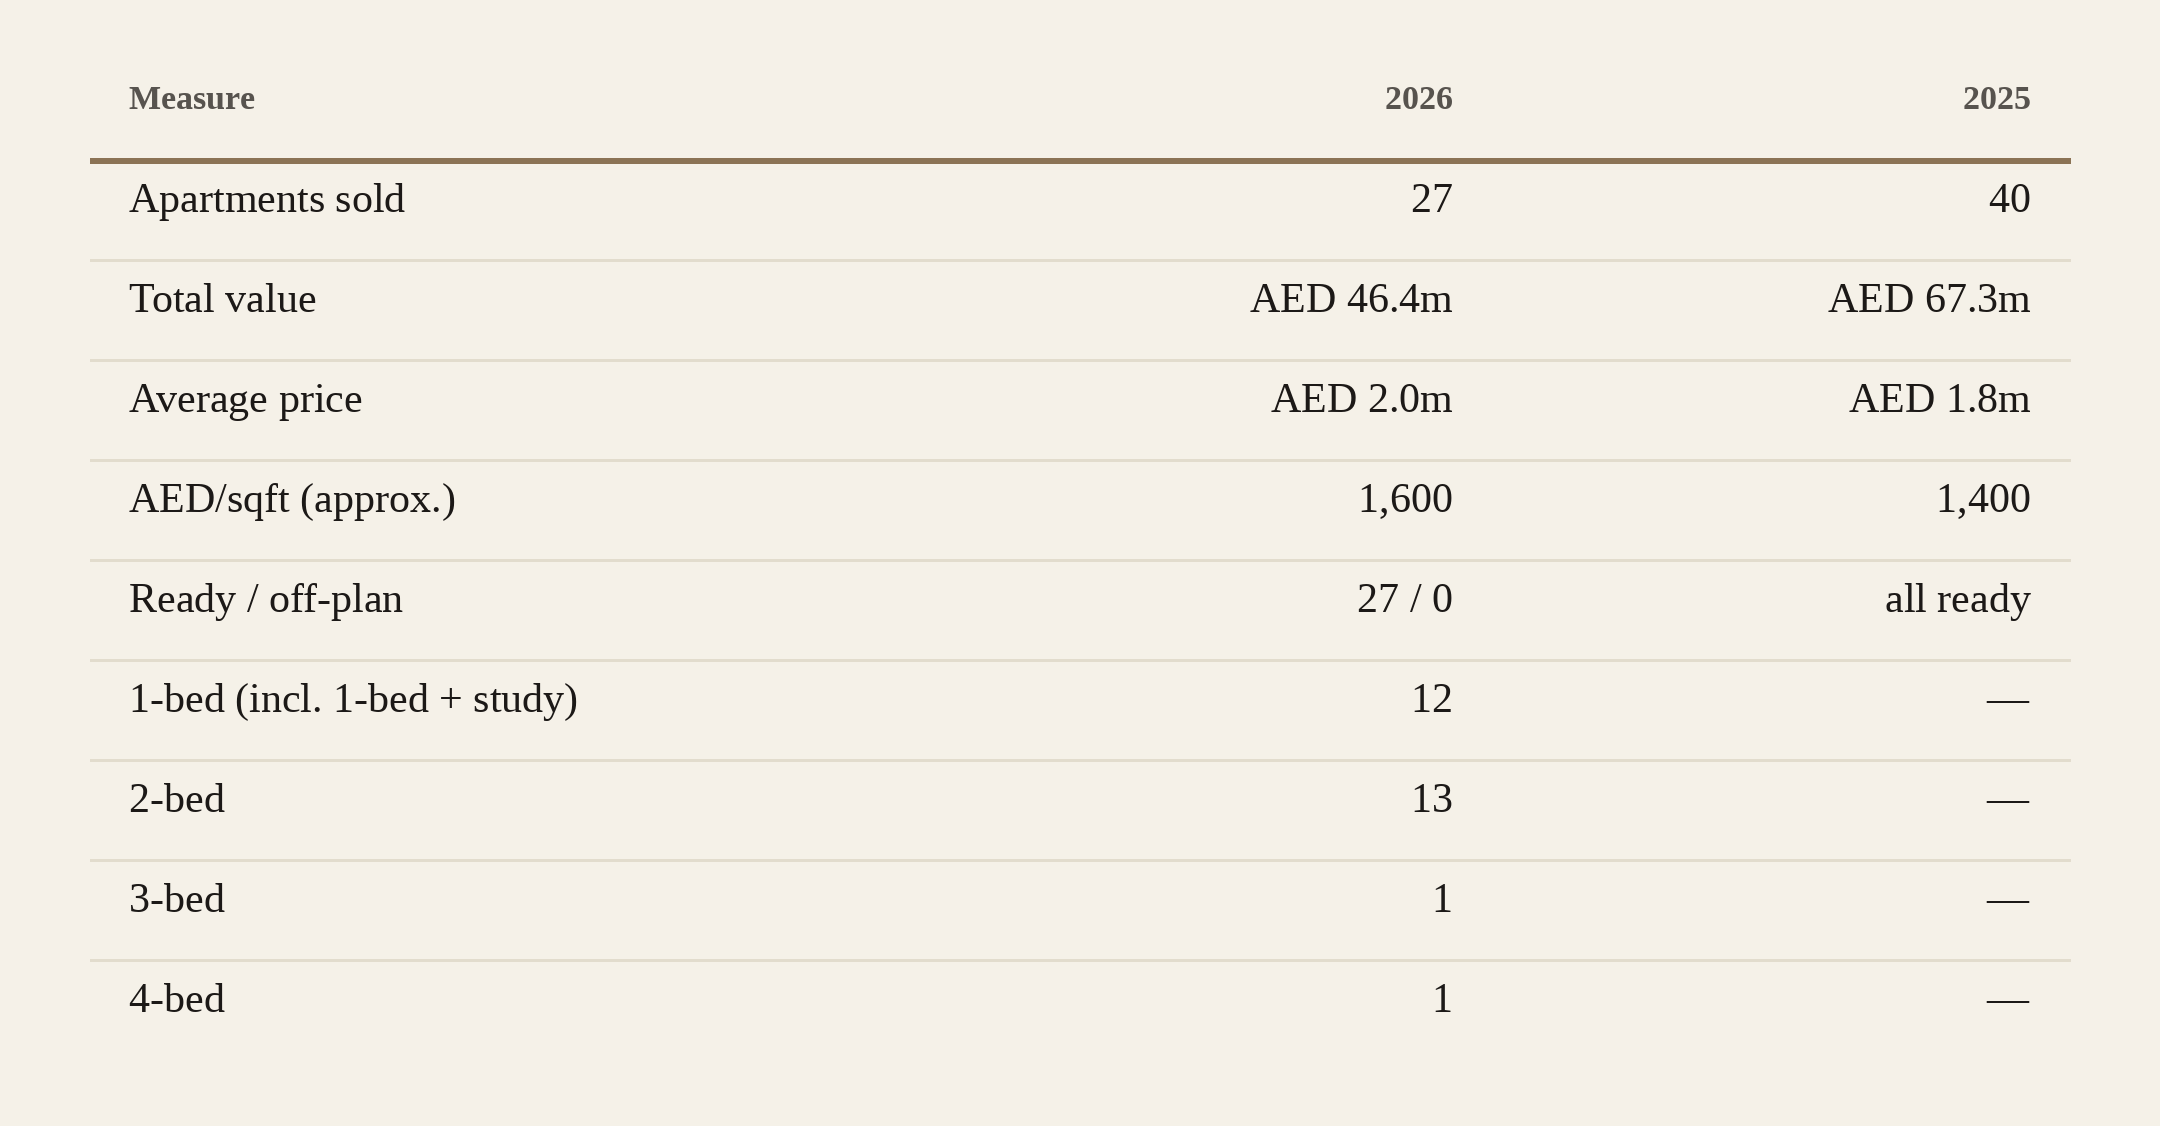
Source: Dubai Land Department, retrieved 8 June 2026. Apartment figures only — separate from, and not included in, the 349 villa sales or any villa total elsewhere in this issue. The bedroom split is shown for 2026; the register groups one-bed and one-bed-plus-study together.
Section 5. How JGE compares with Dubai's other prime communities
JGE sold more villas than any other prime community in Dubai over these five months. 349 in all. Dubai Hills Estate came next at 288. Then Tilal Al Ghaf at 134. Al Barari 37. Palm Jumeirah 33. Emirates Hills 10. Jumeirah Bay Island 7.
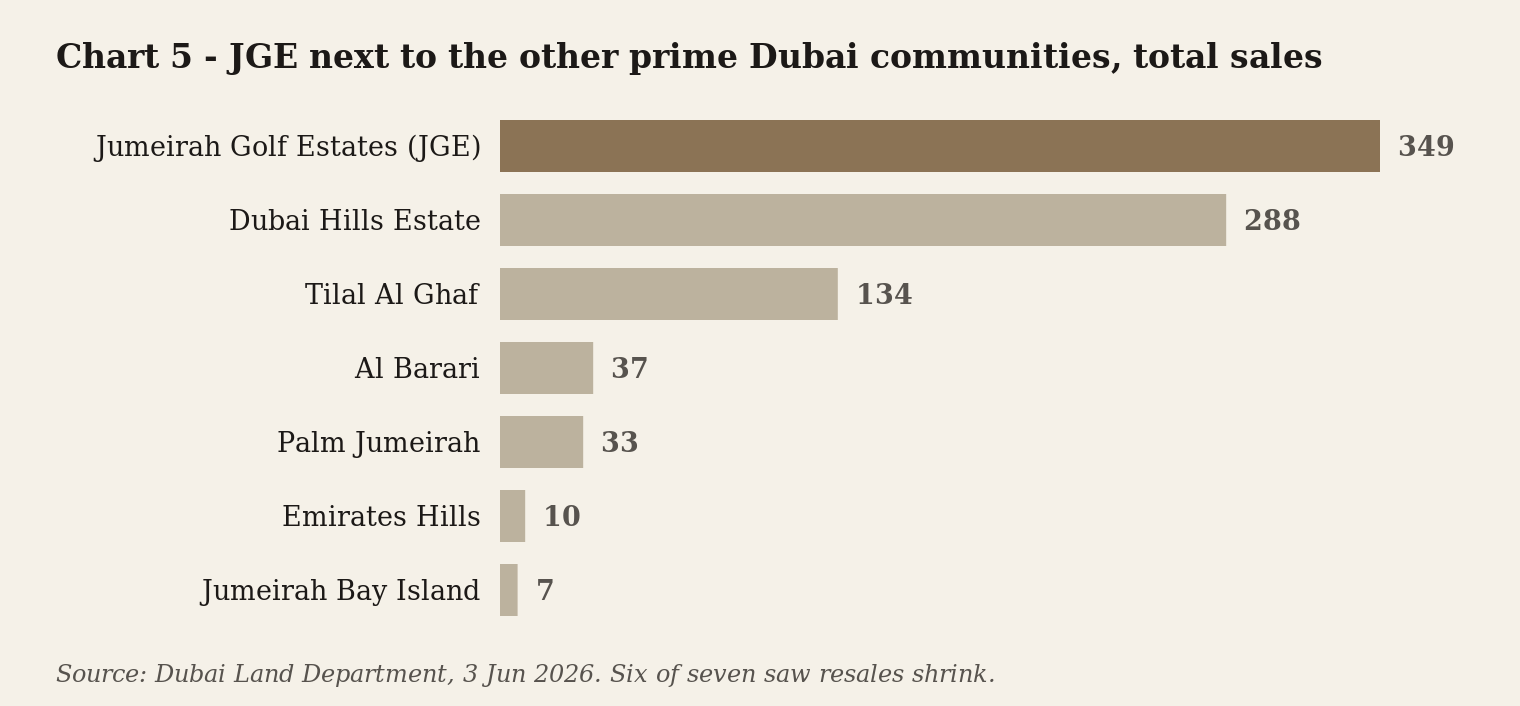
I sorted the chart by how many homes sold, because that is the clearest sign of where the activity really is. The most-traded prime villa community in Dubai over these five months was Jumeirah Golf Estates. That is simply what the record shows.
It matches what I see week to week. JGE sales have been registering faster than the rest of these communities since January, and most of that is off-plan buying in Phase 2. The resale market for finished homes here is slowing in step with the rest of prime Dubai, not on its own.
The average price of a sale swings enormously from one community to the next. Emirates Hills averaged AED 67.2 million. Palm Jumeirah AED 58.7 million. Al Barari AED 25.5 million. JGE at AED 13.2 million sits in the middle. Tilal Al Ghaf at AED 9.0 million is just below it.
One more measure is worth explaining: price per square foot. It is just the price of a home divided by its size, which lets you compare places whose homes are very different sizes. This is the only section where I use it. It runs from AED 2,000 a square foot in Tilal Al Ghaf to AED 8,700 on Palm Jumeirah. JGE sits at AED 2,200. Dubai Hills Estate and Al Barari at AED 2,900. Emirates Hills AED 5,600. Jumeirah Bay Island AED 7,000. Those gaps come from how the homes are built and where they sit, not from one place being better value than another.
The slowdown in resales shows up across almost all of these communities, comparing this year with the same five months last year. Palm Jumeirah's resales fell 42 percent. Emirates Hills 58 percent. Al Barari 14 percent. Tilal Al Ghaf 19 percent. Dubai Hills Estate 22 percent. JGE 52 percent.
Six of the seven saw their resale market shrink. Dubai Hills Estate is the clearest example: its total sales grew 58 percent, yet its resales of finished homes still fell 22 percent. A community can look like it is booming on the headline while its resale market quietly tightens underneath. That is the same split this issue traces in JGE. Jumeirah Bay Island, at seven sales, is too small to read anything into.
Six of seven, the same pattern. The slowdown in JGE's resale market this year is a Dubai-wide story, not something happening only here.
Table 4 — JGE next to the other prime Dubai communities, Jan–May 2026
All the figures side by side. The only place I use price per square foot, to compare communities fairly.
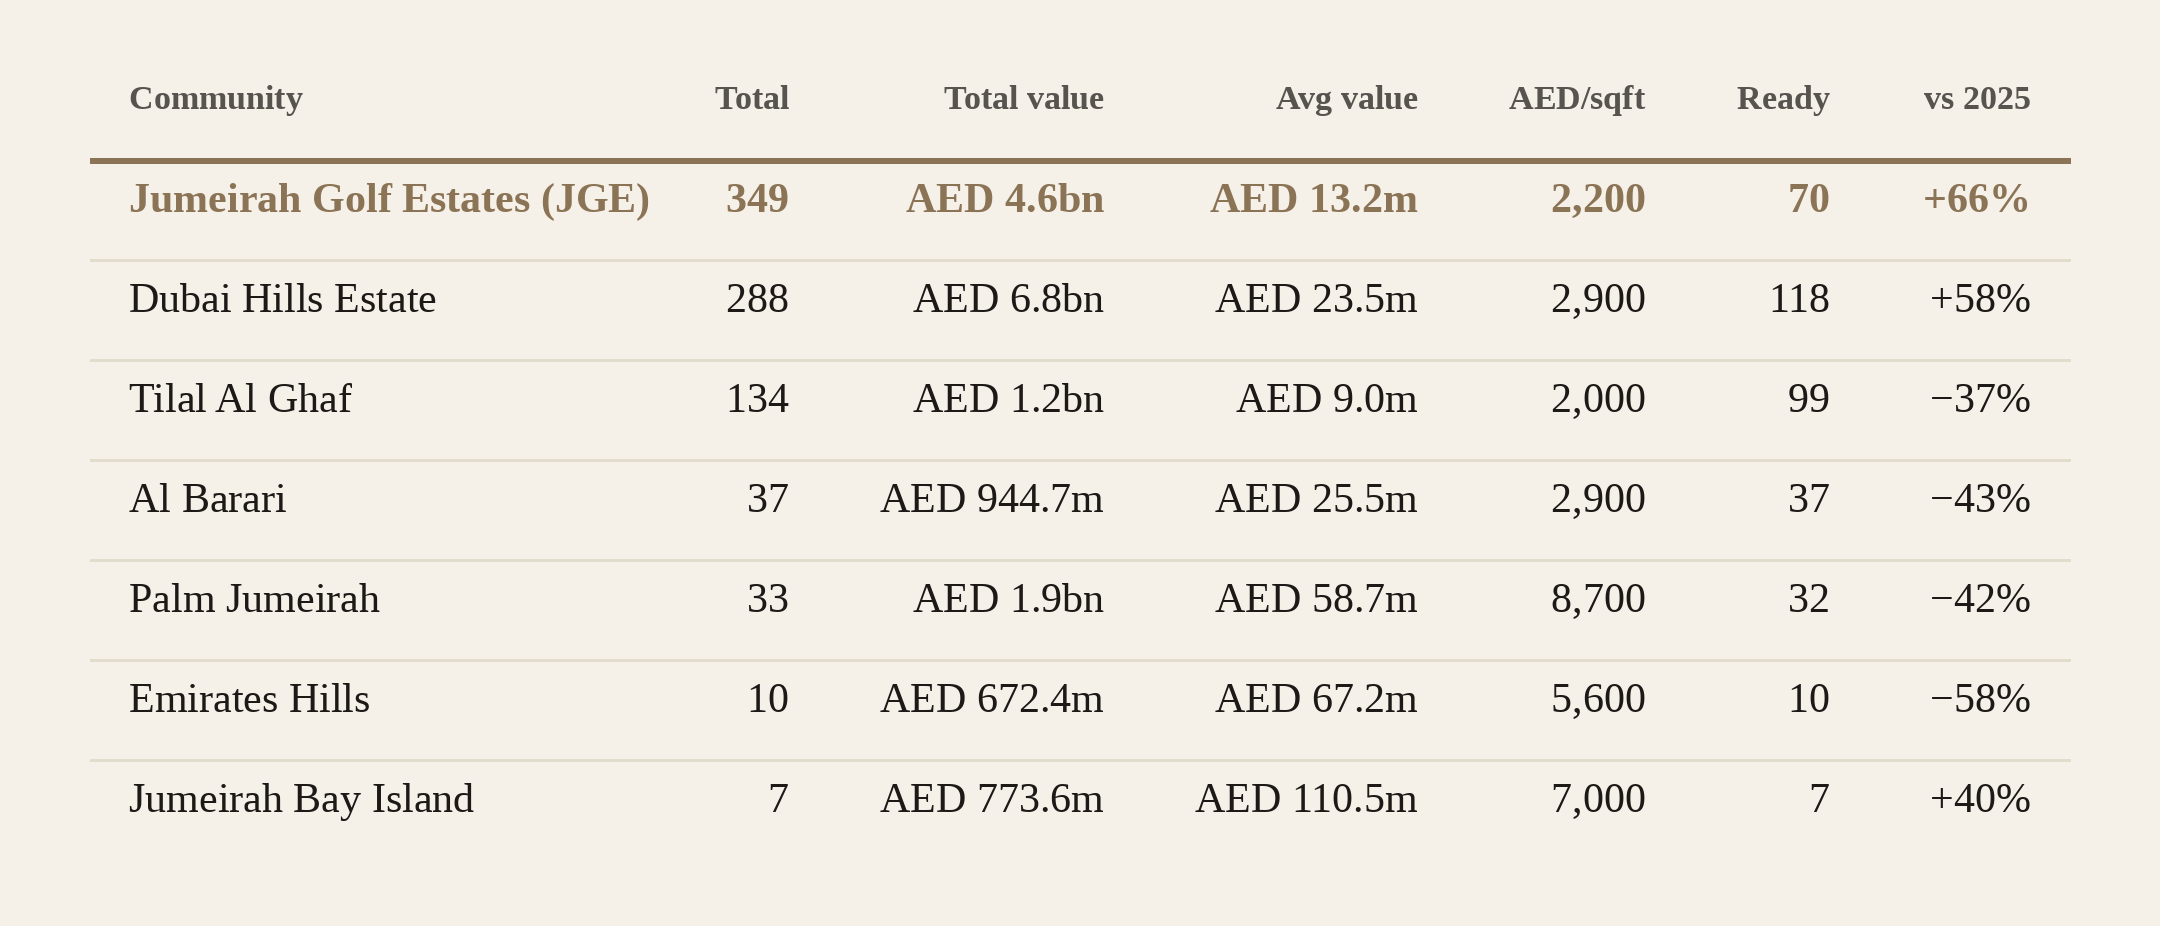
Source: Dubai Land Department, 3–5 June 2026. Six of the seven communities saw resales shrink; Dubai Hills grew 58% overall while its resales still fell 22%. Jumeirah Bay Island figures come from its seven sales, a small sample. Price per square foot reflects how homes are built and where they sit, not value within JGE.
Section 6. Off-plan vs ready in JGE
279 off-plan sales against 70 resales. That is about four to one, and the gap holds steady month after month.
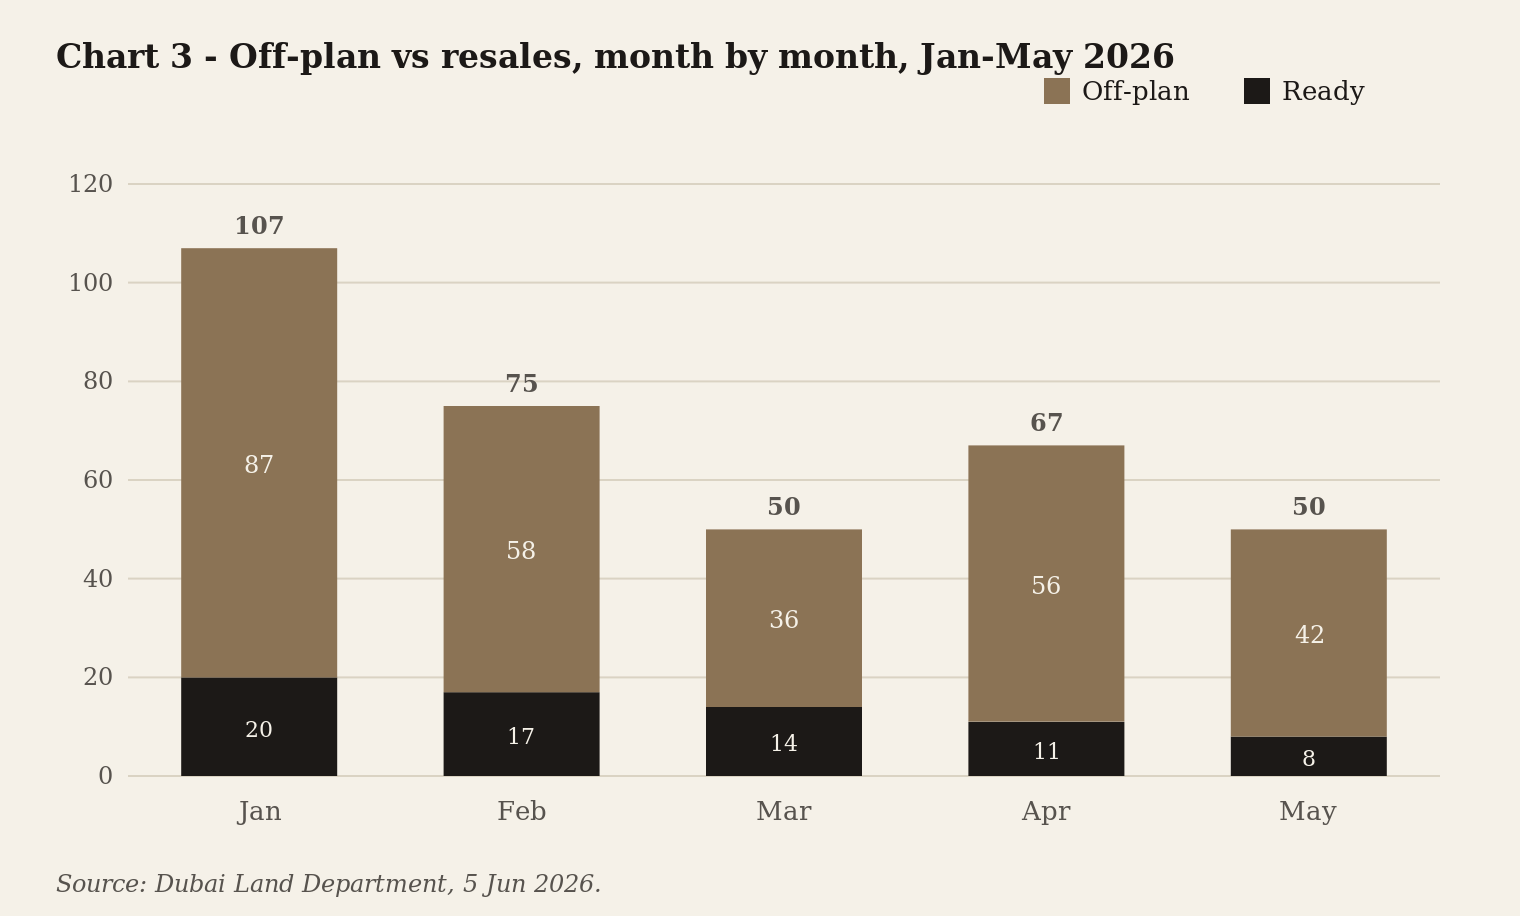
The first is time. The new Phase 2 homes are not finished until 2028 or 2029. Someone buying off-plan today is committing to a three-year wait before they get the keys. The weekly headlines that rattle a cash buyer closing in thirty days mean far less to someone whose home is three years from being built.
The second is how you pay. The Cedarwood Estates South plan is 50/50: half the price spread across the years of construction, half on handover. A buyer who can put down a portion at booking and pay the rest in stages is in a very different position. Compare that with someone paying the full price now for a finished home. The bank rules on deposits and how much you can borrow work out differently for each, and there is a calculator on the site that shows the maths (at /mortgage-affordability-dubai/). The resale buyer needs the cash and a willing seller today. The off-plan buyer needs neither yet.
The third is simply what was for sale. Almost all the off-plan buying was new Phase 2 product, mostly Cedarwood Estates South, which launched in May with 74 villas, plus leftover homes from earlier Wasl launches. Before a launch, Wasl opens a waiting list, an expression of interest, where buyers register early to hold a place. A long waiting list is what keeps a launch selling even when the wider mood is cautious. Cedarwood South's list closed on 15 May 2026.
The resale market never caught that same lift. Owners who would only sell at a strong price kept their homes off the market. That is the thin band along the bottom of the chart above.
Source: Dubai Land Department for transaction figures, retrieved 5 June 2026. Cedarwood Estates South payment plan and launch dates per Wasl public announcements.
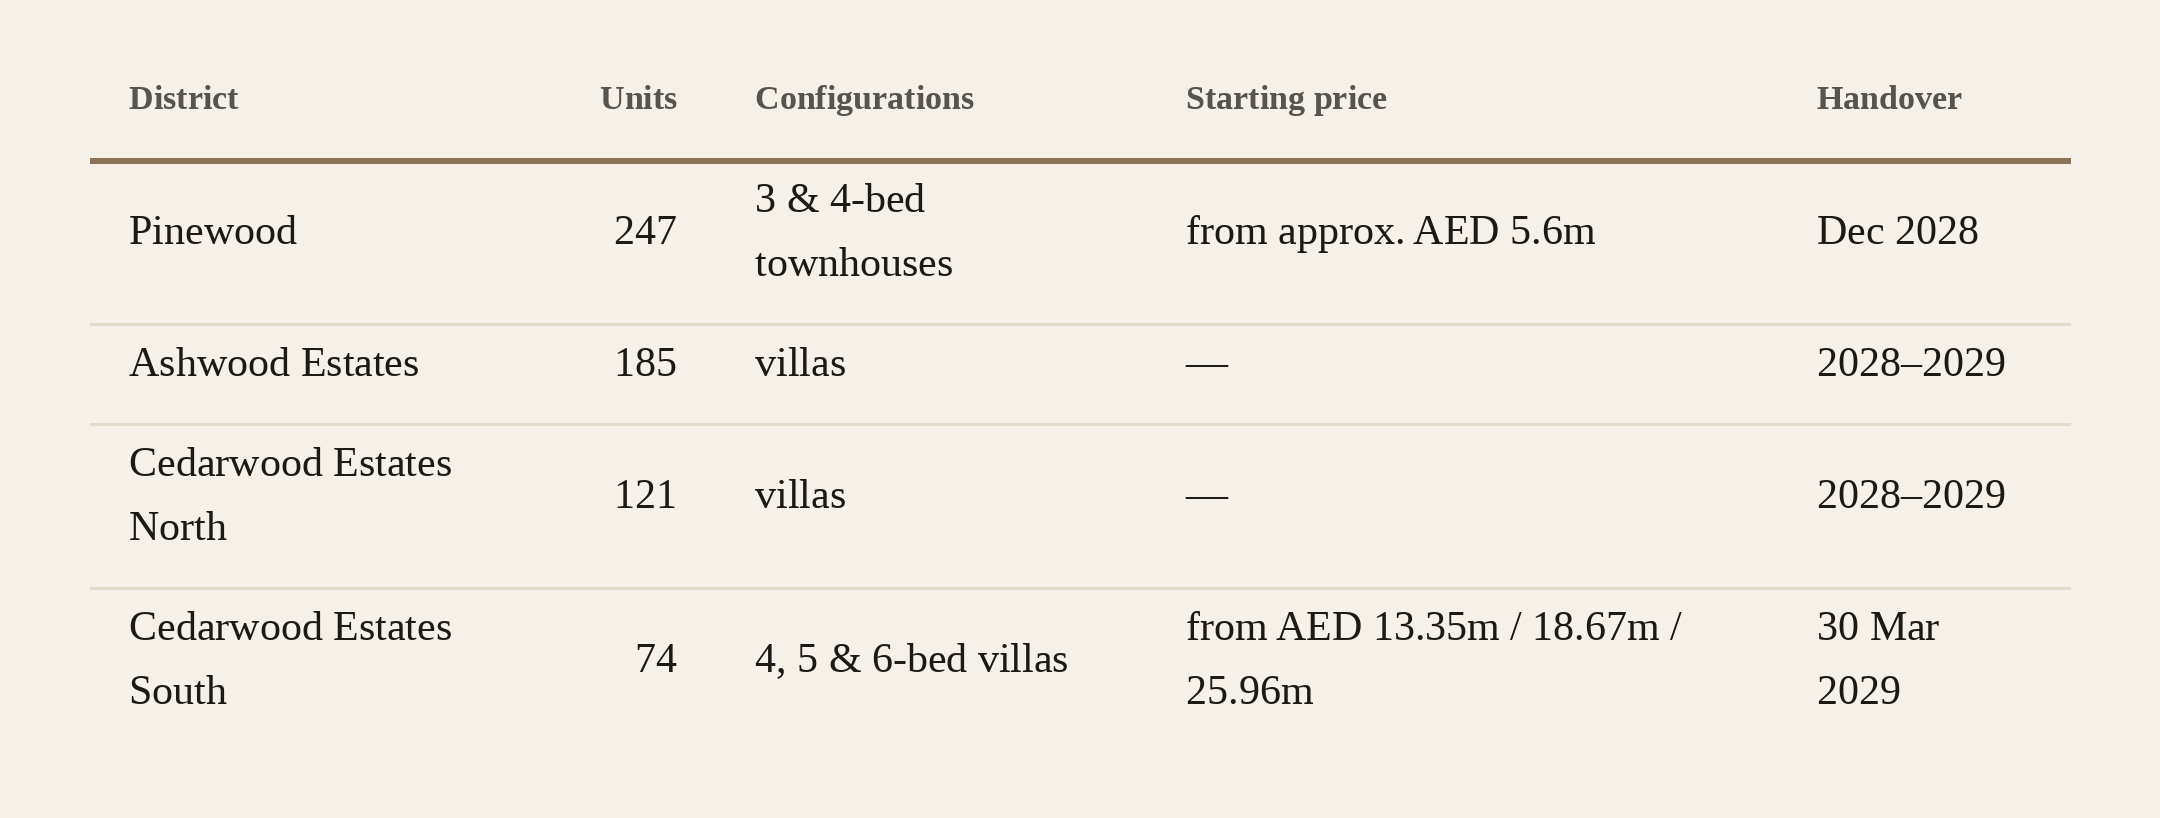
Section 7. Supply pipeline update: Wasl Phase 2 off-plan
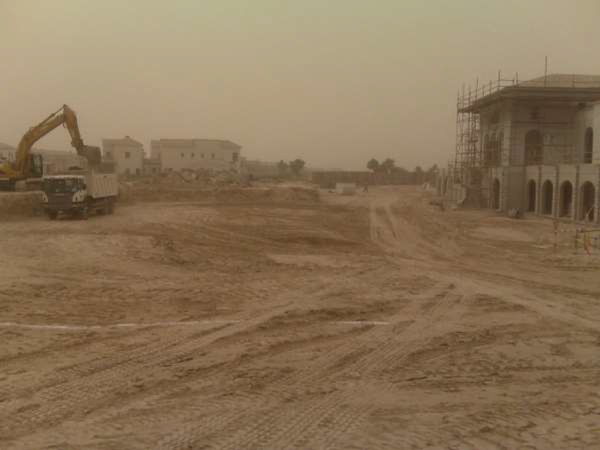
Phase 2 is the new part of JGE, still being built. It is being developed by Wasl, a major Dubai developer, under the name The Next Chapter. The homes hand over, meaning the keys go to buyers, across 2028 and 2029. Four releases have gone out so far.
Pinewood opened the series as the entry level: 247 townhouse-style homes in three and four-bedroom layouts, handing over from December 2028. Ashwood Estates followed at 185 villas. Cedarwood Estates North came next at 121 villas, launched between the last issue and this one. Those are Wasl's own figures for how many homes each holds.
Cedarwood Estates South launched on 21 May 2026. 74 villas in four, five and six-bedroom layouts. Starting prices of AED 13.35 million, AED 18.67 million and AED 25.96 million, on the 50/50 plan, with keys due 30 March 2029. The waiting list closed on 15 May and it is now in sales. If you want to know what is still available, message me on WhatsApp and I will tell you straight.
For the homes already selling, Issue 1 recorded 55 Pinewood sales in the first four months of the year, averaging AED 7.0 million. It recorded 135 at Ashwood, AED 2.2 billion in total, averaging AED 16.0 million. Those are the figures I can stand behind. I will not put a number on how fast anything sold beyond them.
Table 5 — Wasl Phase 2 supply status: The Next Chapter, JGE
Per-launch counts, configurations, starting prices, status and handover, in launch order.
Source: Wasl Group public announcements for launch facts and development sizes; Dubai Land Department for registered figures; observed sales counts per Issue 1 (Pinewood 55, Ashwood 135). All four releases are off-plan. Launch order: Pinewood, Ashwood, Cedarwood North, Cedarwood South. No sell-out velocity is asserted. Pinewood starting price is a registered-agent figure, not Wasl-published.
Most of what is coming over the next two or three years is Wasl's to deliver, from Pinewood's smaller townhouses up to the larger villas of the later releases. A four-bedroom at Cedarwood South now starts higher than what most four-bedroom resales fetch across Phase 1 today. New-build prices have climbed steadily since Ashwood first opened.
You can see where Cedarwood South and the rest of Phase 2 sit on the map at maps.benjaminbakerjge.com.
I report the counts and starting prices for each launch here. If you want the full pricing on any Phase 2 unit, the exact sizes, and the payment terms, message me and I will send it over.
Source: Wasl public announcements for the launch facts; Dubai Land Department for any registered sales figures.
Section 8. The May 2026 picture and Dubai-wide context
May is the month I want to be honest about. 50 villa sales, against 77 in May last year, a drop of 35 percent. Fewer finished homes came up for sale across the period, and by May the count had fallen well below the year before.
This was not just a JGE story. Across the other prime Dubai communities in Section 5, six of the seven saw their resale markets shrink this year. JGE's fell 52 percent. Palm Jumeirah 42 percent. Emirates Hills 58 percent. Al Barari 14 percent. Tilal Al Ghaf 19 percent. Dubai Hills Estate 22 percent.
Dubai Hills Estate grew overall and still saw its resales fall, the same split as JGE. Jumeirah Bay Island was too small to read into.
I named the conflict at the top of this issue, so here I will be specific about what it did to the market. From late February it changed how people moved. Some airline routes shifted, insurance costs on regional shipping rose, and it ran through the nightly news. Cash buyers across Dubai's prime communities slowed through the first quarter and grew more cautious into May. Off-plan buyers, looking three years ahead to their keys, were less affected.
What people did shows up in the sales record. Why they did it is not something I will put words to here. The behaviour is what I am reporting.
Here is what can be said plainly across the six communities that slowed. Fewer finished homes came up for sale. The owners who did list held their asking prices. The new Phase 2 launches still sold off their waiting lists at the prices Wasl had set. The bank rules on deposits and borrowing did not change. What buyers could afford stayed where it was.
Issue 3, in July, will come back to May once the paperwork has fully settled, add June month by month, and cover any new Phase 2 launches.
Source: Dubai Land Department for the sales figures. Public sources for the conflict timeline and its effect on transport and shipping.
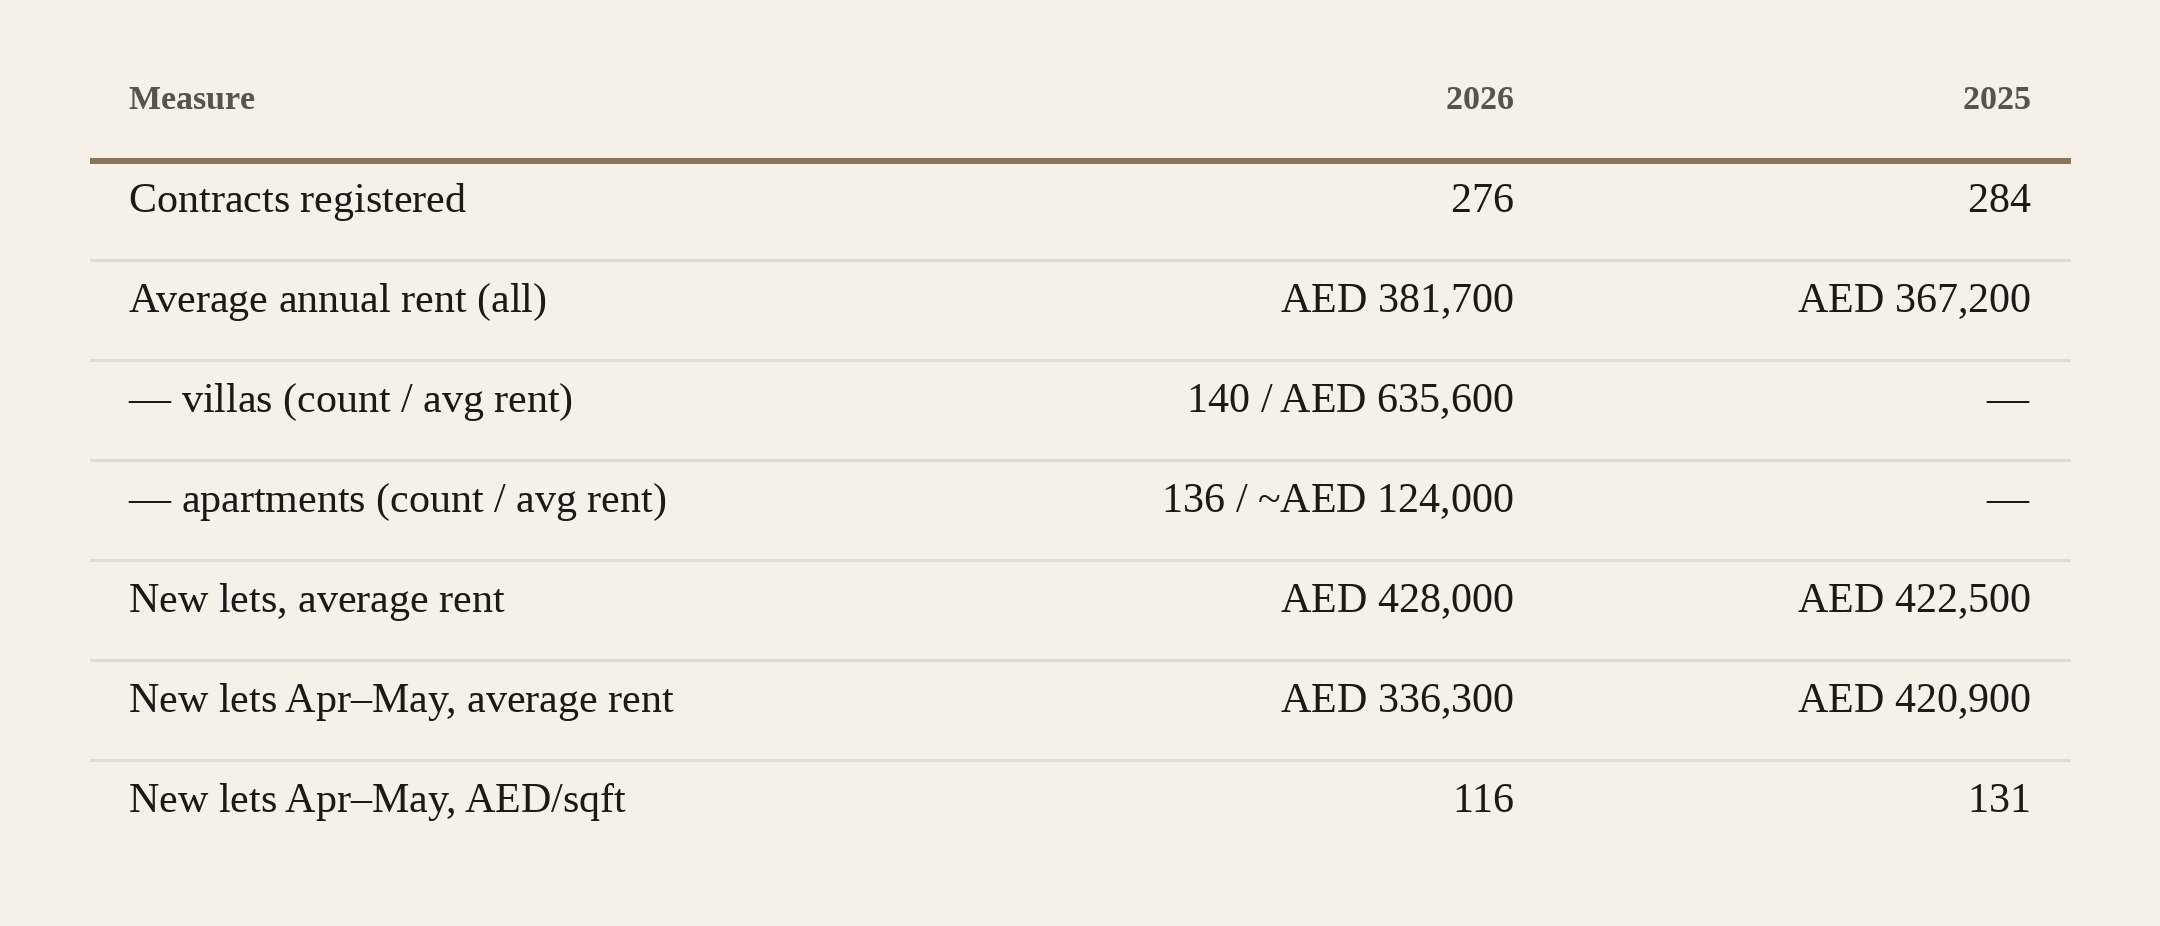
Section 9. Rentals: what JGE is letting for
This issue has been about buying and selling. This last data section is about renting, which is a separate market with its own record. Every lease in Dubai is logged through a system called Ejari, which registers the contract with the Land Department. The figures here come from that register. None of them are sales, and none belong with the sales totals above.
Over Jan–May 2026, 276 JGE rental contracts were registered, against 284 in the same months last year. Almost level. The average annual rent across them was AED 381,700, against AED 367,200 last year. On the full five-month view, rents held, and even edged up.
The market splits in two. 140 of those contracts were villas, letting at an average of AED 635,600 a year. The other 136 were apartments, most of them in Al Andalus, averaging close to AED 124,000. Villas carry most of the rental value; apartments carry nearly half the count.
There are two kinds of contract in the register. A new let is a tenant taking a home for the first time. A renewal is a sitting tenant staying on. Renewals tend to roll over near the old rent, held down by Dubai's rent rules, so they say less about today's market. New lets are the cleaner signal. On new lets alone, the full window looks the same: AED 428,000 average this year against AED 422,500 last year. Flat.
But the full five months hide a turn. When I isolate new lets registered after the conflict, in April and May alone, the rent comes down. AED 336,300 on average this year, against AED 420,900 in the same two months last year. Per square foot, AED 116 against AED 131. That is a fall of about a fifth on the average rent, and about twelve percent per square foot.
The full window looks level because the year opened strong. The January and February leases, agreed before late February, came in firm and held the average up. The softening is in the recent months, and it is in the new lets, exactly where it would show first.
One honest caveat. Ejari registers a contract weeks after the rent is actually agreed, so the register always trails the live market. What I am negotiating on the ground now is softer than what the April and May registrations show, and the most recent lettings will only land in the record over the coming weeks. So what I can stand behind from the register is this: new-let rents in JGE are down between twelve and twenty percent since late February. Twelve percent is the fall per square foot on post-conflict new lets, twenty percent the upper end on average new-let rents. Both are likely to soften further as those recent contracts clear.
This is the rental side of the same story the sales told. Fewer finished homes came up to buy. The homes coming up to rent are letting for less than they would have a year ago. The behaviour is in the record. I will leave the why where I left it earlier in this issue.
Table 6 — JGE rental contracts registered through Ejari, Jan–May 2026 vs Jan–May 2025
Rental figures only. These are separate from every sales figure in this issue. Average rent is the annual contract value.
Source: Ejari rental registrations via the Dubai Land Department, retrieved 8 June 2026. Rental figures are separate from the sales figures elsewhere in this issue. Villa and apartment splits are shown for 2026. The post-conflict softening shows in new lets registered in April–May; registrations lag the live market by several weeks.
Section 10. What's on benjaminbakerjge.com
The map at maps.benjaminbakerjge.com has nineteen neighbourhoods I outlined by hand over a satellite image. Tap any one and you get a short summary, where it sits against the golf courses, and the nearby landmarks. It works on a phone or a computer, and you can tell the finished Phase 1 neighbourhoods from the newer Phase 2 ones at a glance.
The mortgage calculator at /mortgage-affordability-dubai/ runs the Central Bank's rules for first and second homes and shows its working as you go. It gives you an early estimate before you sit down with a bank, not a replacement for that conversation.
I also keep a growing set of reference guides on the site, the evergreen companion to this monthly letter. They explain what JGE is and how Phase 1 and Phase 2 are planned. They also cover the service charges owners pay and the schools near the community, with more added as I write them. The best place to start is the JGE reference guide at benjaminbakerjge.com/what-is-jumeirah-golf-estates, which links on to the rest.
Coming this quarter: deeper pages on each neighbourhood built off the map, a rental-yield calculator, and a buy-versus-rent calculator. The long-promised layer that shows real sales right on the map is close too. That last one switches on once my access to the Land Department's live data clears their sign-off.
The map and the calculators are always there. Each issue just records where the numbers stood that month. If you read one more thing after this, make it the map.
Section 11. Close + methodology footer
Issue 3 lands in July and covers June, month by month, the same way this one did. The May figures will keep firming as the paperwork settles between now and then. I will carry the Al Andalus apartments and the rental market forward as standing sections, and cover anything new from Phase 2.
If anything here raised a question, about a particular neighbourhood, a launch, or just whether now is your moment to move, message me on WhatsApp. I would rather have a real conversation than leave you guessing from a newsletter.
Methodology. Every villa and apartment sales figure in this issue comes from the Dubai Land Department, pulled on 5 June 2026, with the Al Andalus apartment figures pulled on 8 June 2026. As explained earlier, a sale can take one to three months to appear in their public record after it is agreed. That delay is the Form F lag, so the May numbers will keep firming through July. The rental figures in Section 9 come from Ejari, the Land Department's rental-contract register, pulled on 8 June 2026; registrations there lag the live rental market by several weeks in the same way. Sales figures and rental figures are kept separate throughout and are never combined. Where I mention wider market events, I have cross-checked them against established regional press.
Editorial independence is maintained throughout. No advertised content. No sponsored placement. Brokerage relationships are disclosed when relevant to the editorial. Benjamin Baker is Principal Property Consultant at Edwards & Towers, and a JGE resident. His independent observations in this issue draw on five years working in the community.
Copyright © 2026 Benjamin Baker JGE. Issue 2, June 2026. All transaction data reproduced with attribution to the Dubai Land Department.